
A client forwards you a report from the agency that pitched against you. Under a heading called Performance it says: average position 4.2. Your own report, built on the same keyword set, for the same month and the same business, says 11.6. Neither report is wrong. The two numbers answer different questions, and neither report says which question it answered.
That gap is why scorecards exist, and why most of them fail. A scorecard is not a list of metrics. It is a written promise about how each number is produced, so that when a client asks where a figure came from, the answer takes ten seconds instead of a week of email with a data supplier.
Disclosure: I build Rankfinity, a rank tracking and reporting tool, so I have a commercial interest in how agencies measure search visibility. Every technical claim below can be checked against the raw SERP data your own tool returns, and the outbound source is dated.
In short: a scorecard is only as good as the definitions sitting behind it. Before any number goes in front of a client you should be able to say what it counts, where it was measured from, and what would make it move. Anything that fails those three questions belongs in an appendix, not on the front page.
A scorecard is a promise about measurement, not a list of metrics
Most published scorecard templates are a column of metric names with a target next to each one. Traffic, up. Rankings, up. Conversions, up. A template like that survives exactly one meeting, because the first client who asks a real question breaks it. Where did this number come from? Why did it drop by six when nothing on the site changed? Is that the same measurement you showed me in March?
The version that survives has a second column that nobody writes down: the definition. Not what the metric is called, but what it counts, where it was counted from, and what it excludes. Two agencies can both report visibility and mean unrelated things. If the definition lives only in the head of whoever built the spreadsheet, the scorecard is a liability, because it will be inherited by someone who does not know what it promised.
Start from the client’s actual question. A dentist with three locations does not want to know the national average position for teeth whitening. They want to know whether someone standing outside their building finds them. Those are different measurements, and a scorecard that reports the first while the client is asking the second will read as evasive even when every figure on it is correct.
A column of names and targets
Traffic, up. Rankings, up. Conversions, up. It survives one meeting.
A second column: the definition
What the number counts, where it was counted from, and what it excludes.
A scorecard is a written promise about how each number is produced.
Position: define it before you report it
Position is the number every client looks at first and the number most likely to be undefined. The ambiguity is not philosophical. It comes from a concrete choice in the data, and rank tracking tools make that choice differently.
Search results contain two kinds of things: the ten blue links, and everything else Google places among them. Featured snippets, People Also Ask blocks, map packs, video carousels, AI Overviews. A tracker can count position across everything on the page, or it can count position among organic results only. The first gives you a number that describes where the eye lands. The second gives you a number that describes how the page competes.
DataForSEO, which supplies SERP data to a large part of this industry, exposes both as separate fields. On its featured snippet documentation, checked 10 September 2026, the example response shows a featured snippet carrying rank_absolute: 1, which means the snippet occupies the first slot on the page and the organic result underneath it is no longer number one by that count (DataForSEO, Featured Snippet).
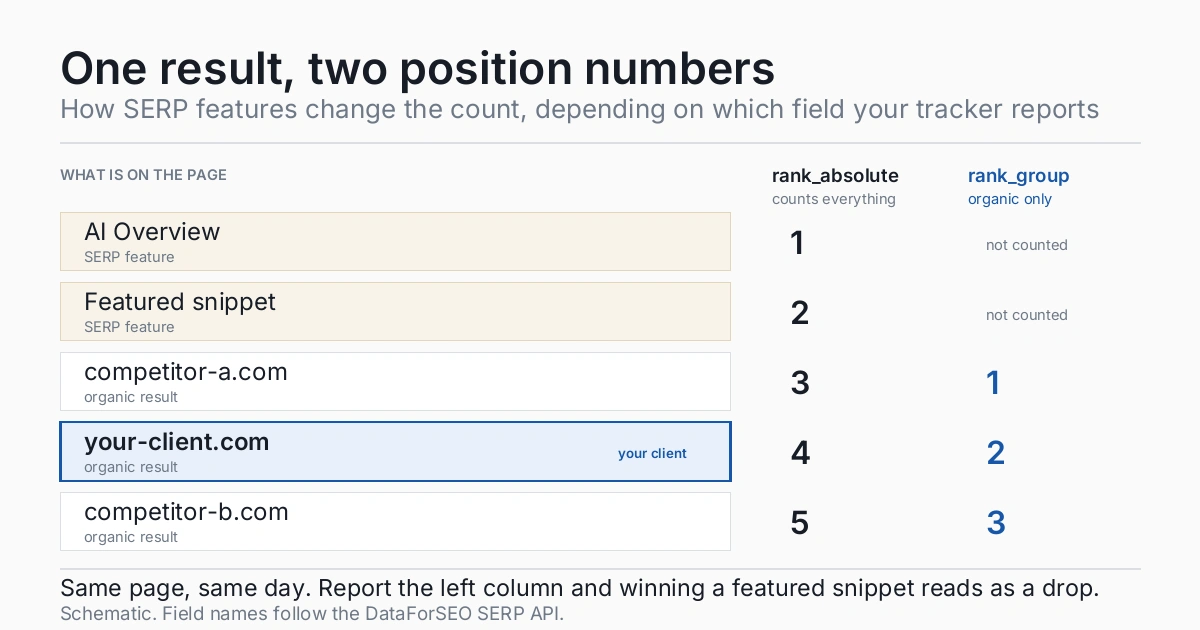
Pick one, write it on the scorecard, and never switch mid-engagement. Switching is how a flat month turns into a conversation about whether your reporting can be trusted. Our organic rank tracking module reports the organic-only figure and applies a featured snippet offset for this reason, but the choice matters more than which way you go. An agency that documents the absolute number and explains it is on firmer ground than one that silently uses the organic figure and cannot say so.
This is also the usual explanation when a client emails a screenshot that disagrees with your report. We wrote up the full set of causes in why two rank trackers show different positions, and the metric definition is the first one to rule out.
rank_absolute position among everything on the page, including featured snippets, People Also Ask, map packs and AI Overviews. Describes where the eye lands.
rank_group position among organic results only. Describes how the page competes.
Switching mid-engagement turns a flat month into a conversation about whether your reporting can be trusted.
Visibility and share of voice: show the arithmetic
Visibility percentages are the second most common scorecard entry and the least standardised. There is no agreed formula. Each tool builds one, and the choices inside it change the answer by a wide margin.
Three decisions do most of the damage. The first is weighting: does a keyword with 40 searches a month count the same as one with 9,000, or is each keyword weighted by volume? The second is the click curve: does position three earn a third of position one, or a tenth, and where did that curve come from? The third, and the one that quietly ruins comparisons, is the keyword set. Share of voice is a percentage of something, and the something is a list you chose. Add twenty keywords the client already ranks well for and the percentage climbs without a single ranking changing.
None of that makes the metric useless. It makes it a metric that must be reported with its inputs attached. A share of voice figure on a scorecard needs the keyword count, the date the set was last changed, and the competitor list next to it. If you cannot show those three, you are reporting a number whose movement you cannot explain, which is the definition of a figure that will eventually embarrass you.
The competitor list deserves its own line. Most tools let you name competitors manually, which means the number reflects your opinion of the market rather than the market. A set built from who ranks on the keywords, refreshed on a stated schedule, is defensible. A set someone typed in during onboarding eighteen months ago is not. The competitor and share of voice module exists for this, but the discipline is the same whichever tool produces the figure.
Weighting
Does a 40 search keyword count the same as a 9,000 search one?
Click curve
Does position three earn a third of position one, or a tenth, and where did the curve come from?
The keyword set
A percentage of a list you chose. Change the list and the number moves.
The local layer changes the whole picture
For any business with a physical location or a service area, a national position number is close to meaningless, and a scorecard that shows only national figures will feel wrong to the client long before they can articulate why.
The reason is that local results vary with where the search happens, and that variation is not small. A restaurant can sit in the map pack for a searcher two streets away and be invisible to one across town. A tracker that requests results for a country or a city returns a single answer for a whole region, which averages away the thing the client is paying you to change.
Measuring it properly means requesting results at specific latitude and longitude points rather than at a region identifier, then repeating that across a grid of points around the location. That turns one keyword into dozens of separate measurements, which is why the resulting picture is expensive to produce and hard to fake. The geo-grid rank tracking module works this way, and any supplier claiming local accuracy should be able to tell you whether they request by coordinates or by region code.
There is a second local trap on the identity side. Business names repeat. Two clinics in the same metro can share a name, and matching results by name alone will attribute one to the other. Matching on the place identifier Google assigns each listing avoids that. If a scorecard reports local visibility, it should say which of the two it does.
One answer for a whole region
Averages away the thing the client is paying you to change.
Dozens of measurements
Expensive to produce and hard to fake. This is the picture the client can argue with.
- Do you request by coordinates or by region code?
- Do you match listings by place identifier or by name?

What AI Overviews do to the top of the scorecard
There is a newer problem that older scorecard templates have no row for. An AI Overview sits above the organic results and answers the query on the page, which means a keyword can hold its position and still send fewer visits than it did last quarter. Position stayed flat. Traffic fell. Nothing you did caused either.
If the scorecard has no field recording whether an AI Overview appeared for a keyword, that month reads as a reporting error or, worse, as your work failing. Recording feature presence per keyword costs nothing at collection time and turns an unexplainable dip into a one-line answer. It also gives you the honest version of the conversation: some queries are being answered before the click, and no amount of on-page work changes that.
Measuring how often a brand is named inside those answers is a separate discipline from rank tracking, and the tooling for it is young and inconsistent. We went through what the current generation of tools does and does not measure in what AI visibility tools measure. For scorecard purposes the minimum is narrower: log whether the feature was present, so the traffic line stays explainable.
Position stayed flat. Traffic fell. Nothing you did caused either.
An unexplained dip
The month reads as a reporting error, or as your work failing.
A one line answer
Some queries are answered before the click, and no on-page work changes that.
Setting the thresholds that make a number green
A scorecard with no thresholds is a data dump. The thresholds are the part that turns numbers into a judgement, and they are the part almost nobody writes down, which is why so many reports leave the client to decide whether the month was good.
Thresholds should be set once, at the start, in writing, and they should be relative to a baseline rather than absolute. Position 8 is a poor result for a low-competition long-tail term and a strong one for a head term in a city with four aggressive competitors. Set the green band against where the account started and against what the competitor set is doing, not against a round number that sounds impressive.
Two practical rules keep thresholds honest. Set them before you see the month’s data, because a threshold chosen after the fact is a rationalisation. And build in a movement floor: rankings fluctuate for reasons that have nothing to do with your work, so a change of one or two places on a single keyword should not be coloured at all. Colour the trend across the set, not the noise inside it.
- Set them once, in writingAt the start of the engagement, not when the month looks good.
- Make them relativeAgainst where the account started and what the competitor set is doing, not a round number.
- Set them before you see the dataA threshold chosen afterwards is a rationalisation.
- Build in a movement floorA change of one or two places on a single keyword should not be coloured at all. Colour the trend across the set.
What does not belong on the scorecard
Cutting entries is harder than adding them, because every removed metric is a number the client used to see. The test is whether you can explain what a movement in the number means and what you would do differently if it moved. If the answer to either is no, it belongs in an appendix.
- Third-party authority scores, invented by tool vendors, not used by Google, and not something your work moves on any reportable timescale.
- Counts of keywords ranking somewhere in the top 100, where movement is mostly index churn on terms nobody searches.
- Raw impression counts with no query breakdown, which rise when a page starts appearing for irrelevant searches.
- Any figure you cannot reproduce. If regenerating last quarter’s report gives a different answer, the number was never measured, it was sampled.
That last one is worth dwelling on. Reports built on live queries change every time they are opened, which means the PDF you sent in March no longer matches the dashboard in September. Freezing the numbers at send time is the only way a scorecard functions as a record rather than a view.
Can you explain what a movement in the number means, and what you would do differently if it moved? If either answer is no, it belongs in an appendix.
Freeze the numbers at send time
Reports built from frozen snapshots keep the sent version and the record identical, so a September dashboard cannot rewrite a March PDF.
The scorecard, field by field
The table below is the shape that has held up under questioning. The right-hand column is the one to read twice, because knowing what a number cannot tell you is what stops it being oversold in a meeting.
| Field | The definition it needs | What moves it | What it cannot tell you |
|---|---|---|---|
| Position | Organic-only or all-SERP-elements, stated explicitly | Ranking changes, and SERP features appearing above the result | Whether anyone clicked, or what the searcher saw on their device |
| Share of voice | Keyword count, weighting method, competitor set, date set was last changed | Ranking changes, and any edit to the keyword or competitor list | Market share, revenue, or anything about buyers rather than pages |
| Local visibility | Grid size, coordinate spacing, and how listings are matched | Listing changes, proximity, category and review signals | Performance outside the measured grid |
| SERP feature ownership | Which feature types are tracked, and per keyword or aggregated | Google layout changes, often with no site change at all | Traffic value, which varies enormously by feature type |
| Keyword set coverage | How the set was built, and the rule for adding or removing terms | Deliberate edits only, which is the point | Whether the set still matches what the business sells |
| Competitor set | Chosen manually or derived from the SERP, and refresh schedule | Market entry and exit, plus your refresh cadence | Commercial competitors who do not compete in search |
Questions to ask before a number goes on the scorecard
Whether the data comes from a tool you pay for or an API you query directly, these are the questions that decide whether a figure is reportable. A supplier who answers them cleanly is one you can defend in a client meeting. One who does not is a figure you should leave off.
| Ask the supplier | Why it decides reportability | A weak answer sounds like |
|---|---|---|
| Which position field does this report use? | Determines whether winning a SERP feature reads as a gain or a loss | “We show the ranking position” |
| Where was the search run from? | Local results differ by street, not by country | “It is set to your target country” |
| How are business listings matched? | Name matching misattributes results between same-named businesses | “We match on the business name” |
| What happens when a SERP feature appears above the result? | Decides whether an unchanged page shows a phantom drop | “Rankings move for lots of reasons” |
| Is history immutable once recorded? | A report that changes after sending is not a record | “The dashboard always shows current data” |
| How was the competitor set built and when was it refreshed? | Share of voice is a percentage of a list somebody chose | “Those are the competitors in the account” |
Run this before the first report goes out, not after a client challenges a figure. The cost of finding out mid-engagement that your position field has been the absolute one all along is a conversation you will not enjoy.
Not after a client challenges a figure. Finding out mid-engagement that your position field has been the absolute one all along is a conversation you will not enjoy.
A five minute scorecard test
- Pick any number on your last report
- Say what it counts
- Say where it was measured from
- Say what would make it move
- Say what it cannot tell you
- If any answer is missing, define the number or remove it
Common questions
How many metrics should an SEO scorecard have?
Few enough that you can explain every one from memory. In practice that lands between five and eight for a monthly client report. The constraint is not attention span, it is accountability: any metric you cannot explain under questioning weakens the ones you can.
Should the scorecard show traffic or rankings?
Both, but never as if they were the same claim. Rankings are what your work moves directly. Traffic is downstream of rankings, seasonality, SERP layout and the click curve, none of which you control. Keeping them in separate blocks stops a good ranking month being buried by a seasonal traffic dip.
Why do our numbers differ from the client’s own tool?
Usually the position field, the search location, or personalisation in the browser the client checked from. Work through those three in that order. Disagreement between two trackers is normal and explainable, and explaining it calmly is more reassuring to a client than a report that never disagrees with anything.
How often should the keyword set change?
On a stated schedule, ideally quarterly, and never quietly. Every change breaks comparability with earlier reports, so the scorecard should record the date the set last changed. A set that never changes stops describing the business; one that changes every month makes trends meaningless.
Does a scorecard replace a full report?
No. The scorecard is the first page, the part a client reads in thirty seconds to know whether to ask a question. The detail behind each number still needs somewhere to live. What the scorecard does is make it obvious which part of the detail is worth reading this month.
Where to start
Take the report you sent most recently and add the definition column. For each number on it, write down what the number counts, where it was measured from, and what would make it move. Anything you cannot fill in is either a metric to define properly or a metric to remove, and both outcomes leave you better off than the version you sent.
When the definitions are settled, the remaining problem is delivery: a client needs to see the same figures you signed off on, not a live view that has moved since. Reports built from frozen snapshots on the client reports module keep the sent version and the record identical, which is the property that makes a scorecard worth building in the first place.